Search

vnstat: a console-based network traffic monitor

February 8th, 2009 edited by Vicho

Article submitted by András Horváth. Guess what? We still need you to submit good articles about software you like!

There are many command-line utilities in the Unix / Linux world that collect network traffic statistics for a chosen interface.

vnstat is different because statistics are collected permanently. It keeps the data in files so traffic monitoring is resumed at reboot. vnstat can be useful in situations when you need to know the exact amount of traffic that goes through the interface for a period longer than the computer is on. For example when you have a mobile 3G internet connection or an xDSL connection that has traffic limit per month, then you can easily check how much traffic you generated.

vnstat can be run without root privileges because it collects data from the kernel’s proc filesystem. It doesn’t have a daemon service, it is simply run by cron periodically. In Debian, the installation creates a cron job where a vnstat -u command is run every 5 minutes:

# /etc/cron.d/vnstat: crontab entries for the vnstat package

0-55/5 *        * * *   root    if [ -x /usr/bin/vnstat ] &&
[ `ls /var/lib/vnstat/ | wc -l` -ge 1 ]; then /usr/bin/vnstat -u; fi

Initially, you have to create the database with this command:

vnstat -u -i wlan1

After creating the database, the statistics can be viewed by running vnstat without any further parameters. Thanks to the cron job, the statistic is updated every 5 minutes. It even remembers the interface name to list:

$ vnstat

Database updated: Tue Jan 27 15:40:01 2009

        wlan1

           received:       2.18 GB (81.3%)
        transmitted:     512.85 MB (18.7%)
              total:       2.68 GB

                        rx     |     tx     |  total
        -----------------------+------------+-----------
        yesterday     95.14 MB |   12.19 MB |  107.32 MB
            today     11.33 MB |    4.47 MB |   15.80 MB
        -----------------------+------------+-----------
        estimated        16 MB |       6 MB |      22 MB

Some command line options allow you to view statistics for specific periods of time. For example:

  • --days
    $ vnstat --days
    
     wlan1  /  daily
    
        day         rx      |     tx      |  total
    ------------------------+-------------+----------------------------------------
       18.01.       231 kB  |     115 kB  |     346 kB
       19.01.    611.72 MB  |   58.16 MB  |  669.88 MB   %%%%%%%%%%%%%%%%%::
       20.01.    400.53 MB  |  200.70 MB  |  601.23 MB   %%%%%%%%%%%%%%:::::
       21.01.      5.87 MB  |    1.56 MB  |    7.43 MB
       22.01.    417.97 MB  |  108.94 MB  |  526.91 MB   %%%%%%%%%%%%%%::::
       23.01.    365.24 MB  |   41.78 MB  |  407.02 MB   %%%%%%%%%%%%::
       24.01.    150.00 MB  |   13.42 MB  |  163.43 MB   %%%%%%
       25.01.    170.17 MB  |   71.52 MB  |  241.70 MB   %%%%%%:::
       26.01.     95.14 MB  |   12.19 MB  |  107.32 MB   %%%%
       27.01.     11.36 MB  |    4.51 MB  |   15.87 MB
    ------------------------+-------------+----------------------------------------
     estimated       16 MB  |       6 MB  |      22 MB
    
  • --weeks
    $ vnstat --weeks
    
            wlan1  /  weekly
    
                                rx      |       tx      |    total
            ----------------------------+---------------+--------------
              last 7 days      1.19 GB  |    253.93 MB  |      1.44 GB
                last week      2.07 GB  |    496.08 MB  |      2.56 GB
             current week    106.52 MB  |     16.71 MB  |    123.23 MB
            ----------------------------+---------------+--------------
                estimated       456 MB  |        68 MB  |       524 MB
    
  • --months
    $ vnstat --months
    
     wlan1  /  monthly
    
       month         rx      |      tx      |   total
    -------------------------+--------------+--------------------------------------
      Jan '09       2.18 GB  |   512.90 MB  |     2.68 GB   %%%%%%%%%%%%%:::
    -------------------------+--------------+--------------------------------------
     estimated      2.53 GB  |      596 MB  |     3.12 GB
    
  • --top10
    $ vnstat --top10
    
     wlan1  /  top 10
    
       #       day         rx      |     tx      |  total
    -------------------------------+-------------+---------------------------------
       1    19.01.09    611.72 MB  |   58.16 MB  |  669.88 MB   %%%%%%%%%%%%%%%%::
       2    20.01.09    400.53 MB  |  200.70 MB  |  601.23 MB   %%%%%%%%%%%:::::
       3    22.01.09    417.97 MB  |  108.94 MB  |  526.91 MB   %%%%%%%%%%%:::
       4    23.01.09    365.24 MB  |   41.78 MB  |  407.02 MB   %%%%%%%%%:
       5    25.01.09    170.17 MB  |   71.52 MB  |  241.70 MB   %%%%::
       6    24.01.09    150.00 MB  |   13.42 MB  |  163.43 MB   %%%%
       7    26.01.09     95.14 MB  |   12.19 MB  |  107.32 MB   %%
       8    21.01.09      5.87 MB  |    1.56 MB  |    7.43 MB
       9    18.01.09       231 kB  |     115 kB  |     346 kB
    -------------------------------+-------------+---------------------------------
    
  • --live gives real-time statistics about the packets currently going through the interface:
    $ vnstat --live -i wlan1
    Monitoring wlan1...    (press CTRL-C to stop)
    
       rx:     113.40 kB/s    99 p/s            tx:      28.42 kB/s    96 p/s
    

Pros and cons

  • Pros:
    • Permanent network traffic statistic that is not forgotten.
    • Very lightweight solution, no daemon service is running in the background (automatically run from cron periodically).
    • Easy to install and use. In vnstat, everything can be done from the command line and it clearly shows how many megabytes have you send/receive in a given day or month.
  • Cons:
    • Internet or remote traffic cannot be separated from local network traffic if it all goes through the interface being monitored.
    • It works for a single host, but it doesn’t scale very well. If you need to monitor a lot of hosts and need detailed graphs, there are better alternatives, such as munin or ganglia.

Availability

There are official packages available in both Debian and Ubuntu (Universe) for a long time now.

Posted in Debian, Ubuntu | 3 Comments »
rtpg-www: Please your dearest with rtorrent’s power

February 1st, 2009 edited by Vicho

Article submitted by Dmitry E. Oboukhov. Guess what? We still need you to submit good articles about software you like!

Many people use a wonderful bittorrent client: rtorrent. It is an extremely easy and convenient program for servers. However, its Command-Line Interface may scare some.

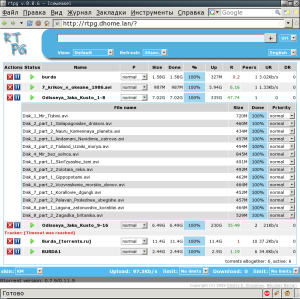
If you’re already using apache then you may use an external GUI for rtorrent. rtpg-www (RTorrent Perl GUI) is a package package that quite recently appeared in Debian (Sid) and Ubuntu (Jaunty). It will please your nearest and dearest with a nice web interface, as they will be able to run rtorrent without having to touch the dreaded terminal :)

rtpg screenshot

The package comes with an already configured virtual server. In its simplest variant all you need to do is:

  1. Answer “yes” on debconf’s question about adding a line to /etc/hosts (only if dpkg asks you medium priority questions)
  2. Switch on the scgi module with a2enmod scgi
  3. Enable the virtual server in apache: a2ensite rtpg.apache.conf
  4. Reload apache to activate the new configuration: invoke-rc.d apache2 reload
  5. Add “scgi_port = localhost:5000″ to your ~/.rtorrent.rc

Now, you can go to http://rtpg/ and start using it! With it you can:

  • add/delete/view the list of torrents.
  • Control torrents’ download priorities, start, and stop them.
  • Control torrents’ file-by-file download priorities.
  • View the statistics: rating, number of peers, download/upload rate, etc.
  • Control the overall download/upload rates (for all torrents).

rtpg Console skinrtpg supports skins which are easy to add by yourself. For those of you who doesn’t want to get out of the habit of using console there is a cool “Console” skin ;)

So install and enjoy! Good luck!

Posted in Debian, Ubuntu | 9 Comments »

iftop - display bandwidth usage on an interface by host

January 25th, 2009 edited by Vicho

Article submitted by András Horváth. We’re running out of articles! If you like Debian Package of the Day please submit good articles about software you like!

Sometimes it’s hard to guess what is eating up our bandwidth the most - on a home computer with an xDSL connection, for example. We can run a lot of programs simultaneously while they can eat as much bandwidth as they want independently of their CPU usage.

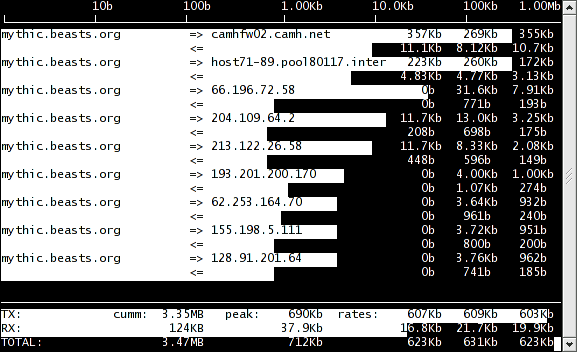
iftopWithout by-host statistics, it would be hard to guess what is slowing down our internet connection the most. iftop helps us to find out with a simple curses based interface and real-time statistics output calculated on a by-host basis. When starting it from a terminal, it starts collecting data and printing them on the screen in lines separated by host name pairs or IP addresses, showing the highest network usage. It refreshes the screen every 2 seconds.

iftop works by reading the host names out of the network packets traversing the interface and then associating them together.

iftop screenshotAfter identifying the host name, we can easily guess which program is generating this particular traffic — that’s why iftop must be run with root privileges.

Though ifstat can be used with complex filtering rules, running it without parameters gives enough statistics in most cases. iftop tries to listen on eth0 by default which might not exist at all. To specify an interface on which to listen, use the -i parameter: iftop -i wlan1, iftop -i eth1.

Pressing the h key while running will display a nice on-screen help, showing the commands that can be triggered interactively in running mode. Some other examples of key commands changing the default state:

  • n turns off name resolving.
  • p turns on port number display.

Pros and Cons

  • Pros
    • Per-host statistics of network usage.
    • Graphical representation of statistics with character bars.
  • Cons
    • Host names are not bound to process names in the statistic, so you have to figure out by yourself which processes they belong to.

Official packages have been available in both Debian (since Etch) and Ubuntu (universe) for a long time now.

Posted in Debian, Ubuntu | 5 Comments »

atop: an ASCII full-screen performance monitor

January 18th, 2009 edited by Vicho

Article submitted by András Horváth. We’re running out of articles! If you like Debian Package of the Day please submit good articles about software you like!

Every system administrator must be familiar with the top(1) command that shows the most active running processes in a Linux environment.

atop is different than that: it shows the most active processes not only related to CPU or memory, but disk and network usage are also calculated into the resource usage statistics. It also calculates incremental statistics, like VGROW (virtual size grow) and RGROW (resident set size grow). For example, if a process is leaking memory, its RGROW will always show positive values.

It can happen that a process starts using the hard disk of the computer making a heavy I/O traffic that takes less CPU resource though, still making the computer response slowly. With the atop utility we can discover this process easily.

atop screenshot For example, if we start the ls -R / command and then run atop, plus we type Shift+A after to get statistics about the processes that use the most system resources, we will see the ls command in the first place with a ‘D’ flag next to it —showing that its mostly used resource is related to Disk and not CPU. You can see this in the screenshot. atop highlights in red the resources if their usage is in critical limits. In the same example, both CPU and disk are being heavily used.

It is recommended to run atop with root privileges in order to see information from all processes. Moreover, when running with root privileges, atop can report about recently finished processes and their exit status.

atop refreshes the information every 10 seconds giving precise statistics. If you want it sooner, just press t to trigger a manual refresh. Pressing h key will give a detail-full on-screen help.

atop installs a daemon service by default and starts himself at boot time. The daemon stores system activity data in /var/log/atop.log. Using the -r command-line option, you can analyze the system activity recorded. Using keys t and T you move forward and backwards in time respectively. You can generate more system activity reports with the atopsar utility, included in the atop package. You don’t need this daemon if all you want is a real-time monitor.

atop can also report about network and disk utilization per process, but you need a patched kernel. Debian packages kernel-patch-atopacct and kernel-patch-atopcnt provide them. Sadly, they are not very well maintained. They were removed from Debian Etch and, in Lenny, the patches included only cover until version 2.6.24 of the Linux kernel (the same happens in Ubuntu). More up to date patches can be found in atop’s webpage. A guide on how to patch and rebuild the kernel is beyond the scope of this article.

  • Pros
    • per-process statistics related to CPU, memory, disk and network.
    • Ability to analyze past system behaviour.
  • Cons
    • Per process disk and network statistics requires patching the kernel.
    • atop installs a daemon service by default. Some people think that the atop daemon should be optional.

You can find atop both in Debian (since Etch) and Ubuntu (since Dapper).

Posted in Debian, Ubuntu | 8 Comments »

dstat: versatile tool for generating system resource statistics

January 11th, 2009 edited by Vicho

Article submitted by András Horváth. We’re running out of articles! If you like Debian Package of the Day please submit good articles about software you like!

During my work with computers, I like to check the usage of system resources in my network. Sometimes a running process takes up too much CPU load, or the disk I/O goes too high. To get a clean picture of how much resources are being used by a client, I used ifstat, top(1) and iostat(1).

Since I have found out about dstat, I can cleanly check out all the system resources used by my computers. dstat prints all the different type of resources in separate columns on a single line, so it is very easy to see the system load globally.

Quoting from the website:

Dstat is a versatile replacement for vmstat, iostat, netstat, nfsstat and ifstat. Dstat overcomes some of their limitations and adds some extra features, more counters and flexibility. Dstat is handy for monitoring systems during performance tuning tests, benchmarks or troubleshooting.

Dstat allows you to view all of your system resources instantly, you can eg. compare disk usage in combination with interrupts from your IDE controller, or compare the network bandwidth numbers directly with the disk throughput (in the same interval).

Here is a sample output that I made on my computer:

screenshot of dstat

Though dstat gives global statistics about the currently used system resources, it might replace several tools in one. Mostly you would run it without any parameters, that makes it very easy to remember too :)

Pros (compared to other programs):

  • All kinds of resource statistics in one single line.
  • No parameters needed in most cases.
  • CSV files can be generated easily to create charts in OpenOffice or Gnumeric.

Cons:

  • No per-process statistics

There are official packages available in both Debian and Ubuntu since very long time.

Posted in Debian, Ubuntu | 6 Comments »

« Previous Entries Next Entries »