atop: an ASCII full-screen performance monitor
January 18th, 2009 edited by VichoArticle submitted by András Horváth. We’re running out of articles! If you like Debian Package of the Day please submit good articles about software you like!
Every system administrator must be familiar with the top(1) command that shows the most active running processes in a Linux environment.
atop is different than that: it shows the most active processes not only related to CPU or memory, but disk and network usage are also calculated into the resource usage statistics. It also calculates incremental statistics, like VGROW (virtual size grow) and RGROW (resident set size grow). For example, if a process is leaking memory, its RGROW will always show positive values.
It can happen that a process starts using the hard disk of the computer making a heavy I/O traffic that takes less CPU resource though, still making the computer response slowly. With the atop utility we can discover this process easily.
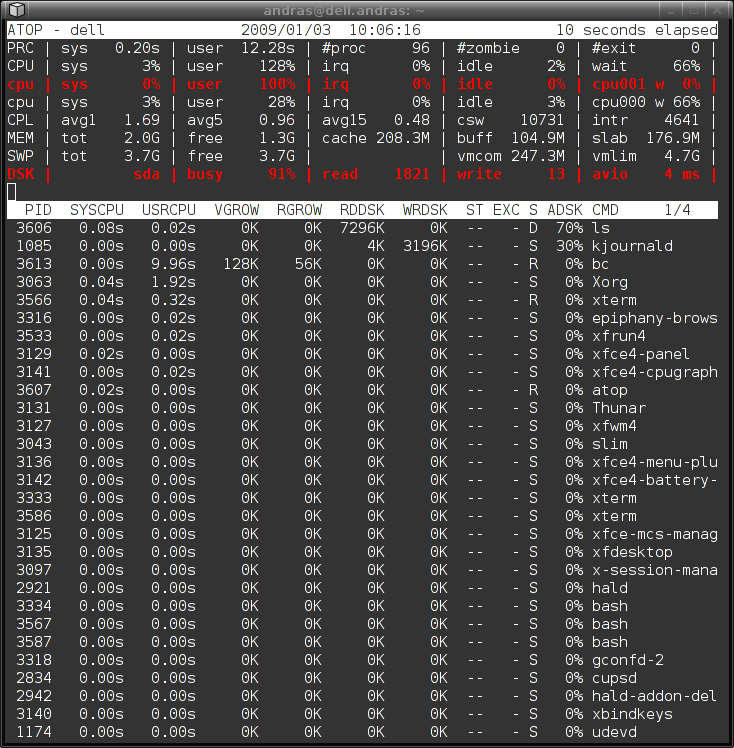 For example, if we start the ls -R / command and then run
 atop, plus we type Shift+A after to get statistics about the processes that use the most system resources, we will see the ls command in the first place with a ‘D’ flag next to it —showing that its mostly used resource is related to Disk and not CPU. You can see this in the screenshot. atop highlights in red the resources if their usage is in critical limits. In the same example, both CPU and disk are being heavily used.
It is recommended to run atop with root privileges in order to see information from all processes. Moreover, when running with root privileges, atop can report about recently finished processes and their exit status.
atop refreshes the information every 10 seconds giving precise statistics. If you want it sooner, just press t to trigger a manual refresh. Pressing h key will give a detail-full on-screen help.
atop installs a daemon service by default and starts himself at boot time. The daemon stores system activity data in /var/log/atop.log. Using the -r command-line option, you can analyze the system activity recorded. Using keys t and T you move forward and backwards in time respectively. You can generate more system activity reports with the atopsar utility, included in the atop package. You don’t need this daemon if all you want is a real-time monitor.
atop can also report about network and disk utilization per process, but you need a patched kernel. Debian packages kernel-patch-atopacct and kernel-patch-atopcnt provide them. Sadly, they are not very well maintained. They were removed from Debian Etch and, in Lenny, the patches included only cover until version 2.6.24 of the Linux kernel (the same happens in Ubuntu). More up to date patches can be found in atop’s webpage. A guide on how to patch and rebuild the kernel is beyond the scope of this article.
- Pros
- per-process statistics related to CPU, memory, disk and network.
- Ability to analyze past system behaviour.
- Cons
- Per process disk and network statistics requires patching the kernel.
- atop installs a daemon service by default. Some people think that the atop daemon should be optional.
You can find atop both in Debian (since Etch) and Ubuntu (since Dapper).
January 18th, 2009 at 3:11 pm
I use HTOP (in debian/ubuntu repos too), is very similar and colorful :)
January 18th, 2009 at 11:04 pm
Nice review, very detail and informative.
January 19th, 2009 at 9:15 pm
I’ll second the htop vote. I find the UI easier to use.
January 19th, 2009 at 10:21 pm
Notice that htop is missing the accounting function. All processes finished between samples are not noticed by htop.
Atop running with root privs knows
about those processes thanks to UNIX accounting.
January 20th, 2009 at 9:43 pm
@Andreu and John
If you think htop is a nice package, you can contribute to this site and write an article about it :-)
It could include comparisons with atop.
February 11th, 2009 at 2:35 am
Hokay. I’ve just withdrawn my vote for htop… since I live in emacs-snapshot latest…..
I’m now using M-x proced
March 22nd, 2009 at 9:41 am
htop is more useful I think, it’s generate readable output that helps you track every thing more fast, it makes htop good monitoring tool for SAs that watching this type of statistics every minutes in work day
May 24th, 2009 at 12:49 am
I use htop too ;)