Search

iftop - display bandwidth usage on an interface by host

January 25th, 2009 edited by Vicho

Article submitted by András Horváth. We’re running out of articles! If you like Debian Package of the Day please submit good articles about software you like!

Sometimes it’s hard to guess what is eating up our bandwidth the most - on a home computer with an xDSL connection, for example. We can run a lot of programs simultaneously while they can eat as much bandwidth as they want independently of their CPU usage.

iftop
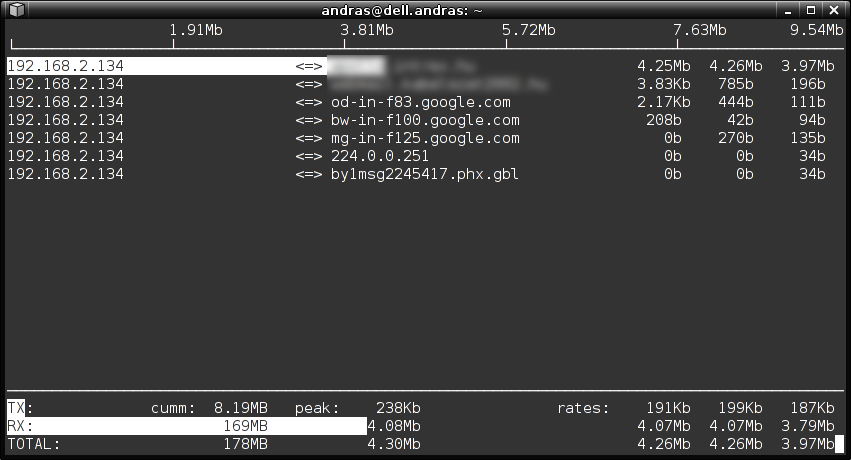
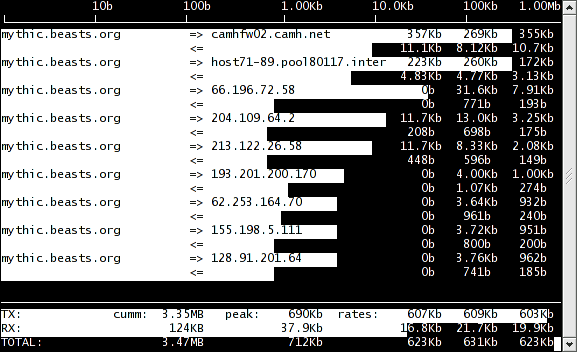
Without by-host statistics, it would be hard to guess what is slowing down our internet connection the most. iftop helps us to find out with a simple curses based interface and real-time statistics output calculated on a by-host basis. When starting it from a terminal, it starts collecting data and printing them on the screen in lines separated by host name pairs or IP addresses, showing the highest network usage. It refreshes the screen every 2 seconds.

iftop works by reading the host names out of the network packets traversing the interface and then associating them together.

iftop screenshotAfter identifying the host name, we can easily guess which program is generating this particular traffic — that’s why iftop must be run with root privileges.

Though ifstat can be used with complex filtering rules, running it without parameters gives enough statistics in most cases. iftop tries to listen on eth0 by default which might not exist at all. To specify an interface on which to listen, use the -i parameter: iftop -i wlan1, iftop -i eth1.

Pressing the h key while running will display a nice on-screen help, showing the commands that can be triggered interactively in running mode. Some other examples of key commands changing the default state:

  • n turns off name resolving.
  • p turns on port number display.

Pros and Cons

  • Pros
    • Per-host statistics of network usage.
    • Graphical representation of statistics with character bars.
  • Cons
    • Host names are not bound to process names in the statistic, so you have to figure out by yourself which processes they belong to.

Official packages have been available in both Debian (since Etch) and Ubuntu (universe) for a long time now.

Posted in Debian, Ubuntu | 5 Comments »

atop: an ASCII full-screen performance monitor

January 18th, 2009 edited by Vicho

Article submitted by András Horváth. We’re running out of articles! If you like Debian Package of the Day please submit good articles about software you like!

Every system administrator must be familiar with the top(1) command that shows the most active running processes in a Linux environment.

atop is different than that: it shows the most active processes not only related to CPU or memory, but disk and network usage are also calculated into the resource usage statistics. It also calculates incremental statistics, like VGROW (virtual size grow) and RGROW (resident set size grow). For example, if a process is leaking memory, its RGROW will always show positive values.

It can happen that a process starts using the hard disk of the computer making a heavy I/O traffic that takes less CPU resource though, still making the computer response slowly. With the atop utility we can discover this process easily.

atop screenshot For example, if we start the ls -R / command and then run atop, plus we type Shift+A after to get statistics about the processes that use the most system resources, we will see the ls command in the first place with a ‘D’ flag next to it —showing that its mostly used resource is related to Disk and not CPU. You can see this in the screenshot. atop highlights in red the resources if their usage is in critical limits. In the same example, both CPU and disk are being heavily used.

It is recommended to run atop with root privileges in order to see information from all processes. Moreover, when running with root privileges, atop can report about recently finished processes and their exit status.

atop refreshes the information every 10 seconds giving precise statistics. If you want it sooner, just press t to trigger a manual refresh. Pressing h key will give a detail-full on-screen help.

atop installs a daemon service by default and starts himself at boot time. The daemon stores system activity data in /var/log/atop.log. Using the -r command-line option, you can analyze the system activity recorded. Using keys t and T you move forward and backwards in time respectively. You can generate more system activity reports with the atopsar utility, included in the atop package. You don’t need this daemon if all you want is a real-time monitor.

atop can also report about network and disk utilization per process, but you need a patched kernel. Debian packages kernel-patch-atopacct and kernel-patch-atopcnt provide them. Sadly, they are not very well maintained. They were removed from Debian Etch and, in Lenny, the patches included only cover until version 2.6.24 of the Linux kernel (the same happens in Ubuntu). More up to date patches can be found in atop’s webpage. A guide on how to patch and rebuild the kernel is beyond the scope of this article.

  • Pros
    • per-process statistics related to CPU, memory, disk and network.
    • Ability to analyze past system behaviour.
  • Cons
    • Per process disk and network statistics requires patching the kernel.
    • atop installs a daemon service by default. Some people think that the atop daemon should be optional.

You can find atop both in Debian (since Etch) and Ubuntu (since Dapper).

Posted in Debian, Ubuntu | 8 Comments »

dstat: versatile tool for generating system resource statistics

January 11th, 2009 edited by Vicho

Article submitted by András Horváth. We’re running out of articles! If you like Debian Package of the Day please submit good articles about software you like!

During my work with computers, I like to check the usage of system resources in my network. Sometimes a running process takes up too much CPU load, or the disk I/O goes too high. To get a clean picture of how much resources are being used by a client, I used ifstat, top(1) and iostat(1).

Since I have found out about dstat, I can cleanly check out all the system resources used by my computers. dstat prints all the different type of resources in separate columns on a single line, so it is very easy to see the system load globally.

Quoting from the website:

Dstat is a versatile replacement for vmstat, iostat, netstat, nfsstat and ifstat. Dstat overcomes some of their limitations and adds some extra features, more counters and flexibility. Dstat is handy for monitoring systems during performance tuning tests, benchmarks or troubleshooting.

Dstat allows you to view all of your system resources instantly, you can eg. compare disk usage in combination with interrupts from your IDE controller, or compare the network bandwidth numbers directly with the disk throughput (in the same interval).

Here is a sample output that I made on my computer:

screenshot of dstat

Though dstat gives global statistics about the currently used system resources, it might replace several tools in one. Mostly you would run it without any parameters, that makes it very easy to remember too :)

Pros (compared to other programs):

  • All kinds of resource statistics in one single line.
  • No parameters needed in most cases.
  • CSV files can be generated easily to create charts in OpenOffice or Gnumeric.

Cons:

  • No per-process statistics

There are official packages available in both Debian and Ubuntu since very long time.

Posted in Debian, Ubuntu | 6 Comments »

tellico: collection manager for books, videos, music, and a whole lot more

January 4th, 2009 edited by Vicho

Article submitted by Dean Serenevy. We are running out of articles! Please submit good articles about software you like!

You’ve heard of book and movie collection organizers, but Robby Stephenson’s tellico is a general purpose collection manager. This application can be used to store information about arbitrary collections of whatever tickles your fancy. Tellico is available from the tellico package in Debian since Sarge and in Ubuntu since Dapper. Tellico is a KDE application, but works fine in other desktop environments.

The Basics

Like any good book or movie collection application, tellico presents the user with a multi-pane window that groups entries by some customizable criterion (I’ve grouped by director below), lists entries by some fields (customizable), and shows thumbnails.

Typical movie database

Selecting a list entry shows a more detailed view and a larger thumbnail. Clicking the image in this view launches your image editor.

Viewing an entry

Most of the built-in collection types include search sources to make adding new entries easy. Tellico has default search sources for Amazon.com (US, Japan, Germany, United Kingdom, France, and Canada), IMDb (movie database), z39.50 servers (bibliographic database), SRU servers (bibliographic database), PubMed (Medicine bibliography), CrossRef.org (bibliographic database developed by a consortium of publishers), and some others. You can also write your own script that performs the search and returns entries in a supported format.

Searching for every Debian user's favorite movie

The search box will filter results based on regular expression queries. Complex filters can be named and will be saved with the collection file.

So many movies, so little time

Beyond Books and Movies

Tellico’s built-in list of collection templates is already quite impressive. It provides default templates for books, bibliographies, videos, music, video games, coins, stamps, trading cards, comic books, and wines. However, users are free to modify, add, or remove fields in these collections or even create custom collections with arbitrary fields.

For example, I keep a collection of hyperplane arrangement examples in a custom tellico file. Tellico happily keeps a fully group-able and search-able record of my coefficient fields, polynomials, and other fields.

Arrangements of hyperplanes

Editing a custom entry looks just like editing a standard record type. Fields are grouped by customizable categories.

Editing a record

Modifying the collection fields is wonderfully simple. Your fields may be any of several field types including: text, paragraph, choice, checkbox, table, URL, date, and image. Field upgrading is supported between compatible field types.

Fields may be auto-formatted as names or titles if you wish. You can also control whether the field should support auto-completion (using existing entries in your collection), multiple values, or whether the field should appear in the grouping combo box.

Editing the fields in a collection

The paragraph field type supports basic HTML markup (used here in my bibliography collection). The red letters are KDE’s spell-check attempting to be useful.

HTML markup in a paragraph field

I use the table field type in my recipe collection.

Using a table for an ingredient listing

Beyond the Application

Tellico can import and export data to and from many sources (Bibtex, CSV, PDF metadata, Alexandria, …). It can export your collections (even custom collections) to HTML and generate HTML reports in several styles. Tellico even has limited support for sending citations to OpenOffice.org Writer (though I have never used this feature).

Moreover, since Tellico stores its data in a fully documented XML file you can write XSLT or use any XML parser to transform the data file however you like.

Tellico supports loan tracking for any collection type. It also translated into more than ten languages.

The not so good

Tellico is somewhat laggy when loading hundreds or thousands of images from disk and occasionally when switching from thumbnail view to entry view. However, switching between entries is always fine and collections with fewer images are quick and responsive.

Alternatives

There are many special-purpose collection managers (most of which are listed on the tellico homepage), but tellico is one of the earlier general purpose managers. Some applications (such as GCstar) are becoming more general-purpose as they mature. Others (such as Stuffkeeper) are simply younger applications and are not yet stable. Tellico is a well-designed application and therefore can give even the special-purpose collection managers a run for their money.

Posted in Debian, Ubuntu | 7 Comments »