dstat: versatile tool for generating system resource statistics
January 11th, 2009 edited by VichoArticle submitted by András Horváth. We’re running out of articles! If you like Debian Package of the Day please submit good articles about software you like!
During my work with computers, I like to check the usage of system resources in my network. Sometimes a running process takes up too much CPU load, or the disk I/O goes too high. To get a clean picture of how much resources are being used by a client, I used ifstat, top(1) and iostat(1).
Since I have found out about dstat, I can cleanly check out all the system resources used by my computers. dstat prints all the different type of resources in separate columns on a single line, so it is very easy to see the system load globally.
Quoting from the website:
Dstat is a versatile replacement for vmstat, iostat, netstat, nfsstat and ifstat. Dstat overcomes some of their limitations and adds some extra features, more counters and flexibility. Dstat is handy for monitoring systems during performance tuning tests, benchmarks or troubleshooting.
Dstat allows you to view all of your system resources instantly, you can eg. compare disk usage in combination with interrupts from your IDE controller, or compare the network bandwidth numbers directly with the disk throughput (in the same interval).
Here is a sample output that I made on my computer:
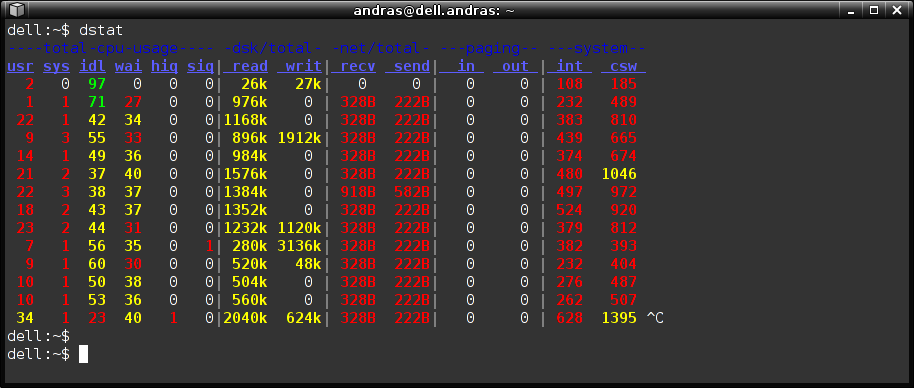
Though dstat gives global statistics about the currently used system resources, it might replace several tools in one. Mostly you would run it without any parameters, that makes it very easy to remember too :)
Pros (compared to other programs):
- All kinds of resource statistics in one single line.
- No parameters needed in most cases.
- CSV files can be generated easily to create charts in OpenOffice or Gnumeric.
Cons:
- No per-process statistics
There are official packages available in both Debian and Ubuntu since very long time.
January 11th, 2009 at 9:34 am
Nice! Thanks.
January 11th, 2009 at 11:07 am
any suggestion for similar tool with per-process statistics?
January 11th, 2009 at 11:10 am
@letso:
Next Sunday, we will publish an article which shows per-process statistics (and more!)
Stay tuned! :-P
January 11th, 2009 at 11:10 pm
@letso:
You could use atop (with atopsar like atsar) (not in etch, but in lenny+)
January 12th, 2009 at 7:17 am
Nice tool, I’ve been using htop and saidar. Will add dstat to my toolbox :)
January 12th, 2009 at 6:35 pm
@Javi: that’s right! Next Sunday’s article is about atop.