mytop: a top clone for MySQL
December 26th, 2007 edited by TinchoArticle submitted by Claudio Criscione We are running out of articles! Please help DPOTD and submit good articles about software you like!
Ever wondered “what the hell is that mysql server doing”? Search no longer, My top is the answer.
Mytop is a clone of top, a utility every sysadmin knows about, but instead of monitoring the system, it follows MySQL threads. In a nutshell, it’s a nifty command line tool that will connect to a MySql server and periodically run the SHOW PROCESSLIST and SHOW STATUS commands. It will then provide nice summaries of the results, and let the user apply various filters.
After the installation you can run mytop providing some parameters, for example: mytop -u root -p rootpass -d database, where database is the database you want to monitor, or you may create a .mytop file containing the configuration directives so you don’t have to type everything every time.
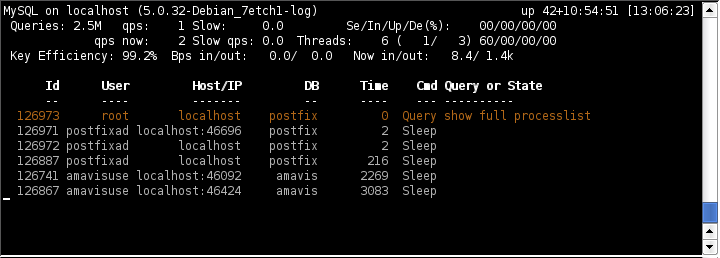
As you can see in the screen shot, the main screen can be divided in two parts. The upper part, the header, which you can remove pressing H, contains statistical informations on the server. On the the first line, you have the host name, the version and the uptime of the MySQL server (in days+hour:minutes:seconds format).The second line will show you the total number of queries the server has processed and the average number of query per second. The slow label marks the number of slow queries —remember you can log slow queries configuring your mysql server.
The third line contains now information: queries per second, slow queries and —if your MySQL version is recent— threads information. On the fourth line you can see the efficiency of the key buffer —that is, how often mysql will find keys in the buffer instead of reading from the disk— the average number of bytes that MySQL has sent and received and how many bytes it is sending and receiving now.
The second part of the screen will list the active threads. As you can see in the screen shot, the thread mytop is using will be listed too. The thread list will show you the user name, database and host name for each thread, which query each thread is running or its state. As the documentation states, it might be a good idea to run mytop in an xterm that is wider than the normal 80 columns if possible, so you can see the whole line.
While inside mytop, you can use h and d to filter for a particular host or database in the thread list, or u to filter on user name. The F key will reset all the filters.
A very useful command is the k command, able to kill a given thread, and you can use f to get more information about a running thread.
If you want to embed mytop in your script or webapp, you can use the -b switch to have mytop run in batch mode. In batch mode, mytop runs only once, does not clear the screen, and places no limit on the number of lines it will print; as the documentation says.
Mytop has been available both Debian and Ubuntu since a long time ago.
December 26th, 2007 at 2:34 pm
a better alternative is innotop: http://innotop.sourceforge.net/
December 27th, 2007 at 9:43 am
Oh yes sebest, innotop is very nice but I needed to monitor MyIsam tables :P. Maybe I’ll write about innotop next time!
December 27th, 2007 at 10:06 pm
Great! I don’t know this tool. I stop to cry when MySQL is too slow and I don’t know what it’s doing :)
I’m going to try it at the moment :)
Thank you :)
January 17th, 2008 at 4:08 pm
innotop actually does everything mytop does, plus a lot more. It’s true that it started out as an InnoDB transaction monitor, but it’s not limited to InnoDB anymore.
Not that mytop isn’t a great tool, I just wanted to dispel the myth that you can’t use it for MyISAM.
I’m the author of innotop. I probably could have chosen a better name for it, but oh well.